ProduceIQ: Weather whiplash rattles produce markets
Week #11 weather is living up to March’s volatile reputation. As a result, this week’s weather could make or break markets as we near spring.

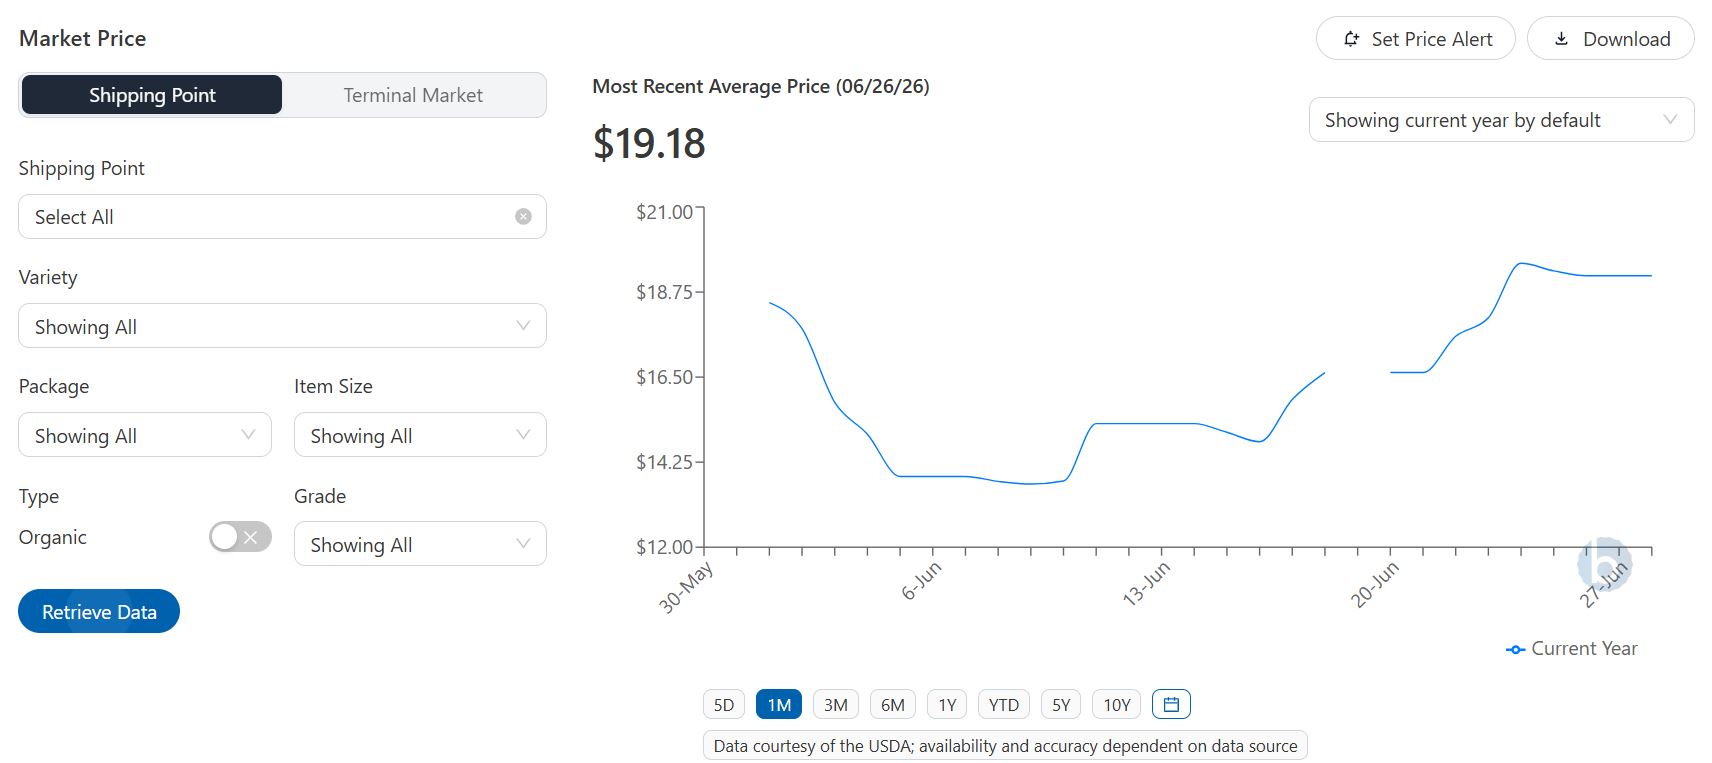
Images courtesy ProduceIQ
Week #11 weather is living up to March’s volatile reputation. A blizzard in the Northeast, a heat dome over the Southwest, a polar vortex stretching across the Midwest and East, and an atmospheric river over Hawaii all point to a jet stream running wild.
As a result, this week’s bout of wacky weather could make or break markets for quite a few commodities as we near Spring transition.
In the West, the heat dome could prompt an early end to the desert growing season in Arizona before growers in California are ready to take over. Meanwhile, in the East, significantly below-average temperatures in week #11 may delay the start of Spring crops for growers in the Southeast and reduce the volume of crops in season.
ProduceIQ Index: $1.13/pound, up +0.9 over prior week
Week #11, ending March 13th
Blue Book has teamed with ProduceIQ BB #:368175 to bring the ProduceIQ Index to its readers. The index provides a produce industry price benchmark using 40 top commodities to provide data for decision making.
Beyond weather, oil prices and the conflict in Iran continue to dominate headlines this week. The conflict is causing the price of crude oil to surge above $100 for the first time since Russia’s invasion of Ukraine. The high cost of oil will inevitably spill over onto the prices of fresh produce. For now, the only hope is that governments find a way to safely reopen the Strait of Hormuz to commercial traffic as soon as possible.
Together, these forces are setting the stage for heightened volatility across several produce markets as the industry approaches the seasonal spring transition. Against this backdrop of weather volatility and rising energy costs, several produce markets are already beginning to react.
Lime markets reach the second-highest price in the last ten years. Strong demand and limited supply have pushed average lime prices up +18 percent over the previous week. Wet and cooler weather in Mexico and a seasonal decline in Mexican production are quelling supply, but markets may soon turn a corner as the onset of Spring in late March marks the annual increase in supply from growers in the Oxnard/Ventura areas. Expect prices to peak sometime in the next two weeks. In the meantime, look to supply out of Colombia to cover shorts.

Tomato markets tell a different story. Average tomato prices decline week over week across varieties. Round-type tomato prices are down -32 percent, grape-type -9 percent, and plum-type -48 percent over the previous week. Rain in Florida and the seasonal transition in Mexico to Sonora are suppressing supply. However, despite tight supply conditions, poor demand this week has led to a significant decline in average prices week over week. Volatility is forecasted to persist through March.

Celery markets are also easing. Like tomato markets, a decrease in the average price of celery has been a long time coming for buyers. Average prices are down -27 percent over the previous week. Increasing supply from growers in Oxnard and Santa Maria, California, is providing some much-needed relief. Even so, week #11 celery prices remain well above average. Supply will likely continue to decrease through Spring.

Finally, warm weather in Western Mexico is threatening a fragile asparagus supply. Average grass prices are up +10 percent over the previous week and are well above average for week #11. Supply is forecasted to decline, and prices are expected to increase over the next four weeks as markets await the arrival of Peruvian supply in mid-April.

ProduceIQ saves you time and provides valuable information to increase your profits.
The ProduceIQ Index is the fresh produce industry’s only shipping point price index. It represents the industry-wide price per pound at the location of packing for domestic produce and at the port of U.S. entry for imported produce.
ProduceIQ uses 40 top commodities to represent the industry. The Index weights each commodity dynamically, by season, as a function of the weekly 5-year rolling average Sales. Sales are calculated using USDA Agricultural Marketing Service data on movement and prices. The Index serves as a fair benchmark for industry price performance.

News you need.
Join Blue Book today!
Get access to all the news and analysis you need to make the right decision --- delivered to your inbox.


Subscribe to our newsletter
© 2026 Blue Book Services. All Rights Reserved

