


















ProduceIQ: Weather carves into holiday produce supply as prices climb
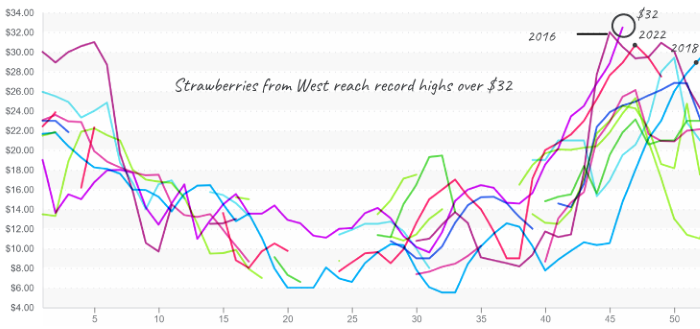
Strawberry prices continue their historic run. Average prices are up 15 percent over the previous week due to extremely tight supply.

Images courtesy ProduceIQ
South Georgia bows out early as a freeze prompts a hasty transition to growers in South Florida, setting the stage for a holiday produce market that’s beginning to feel more like my kitchen an hour before 30 relatives show up for Thanksgiving: pots boiling, timers beeping, and everyone pretending this is all totally under control.
On the West Coast, an atmospheric river is threatening what remains of fall production in the Salinas/Watsonville areas. Fortunately, volume is ramping up out of Huron, and increasing supply is already quelling record-high lettuce prices.
Other desert-grown commodities will follow suit over the next four weeks, offering at least a little relief before peak holiday demand kicks in.
ProduceIQ Index: $1.14/pound, +2.7 percent over prior week
Week #46, ending Nov 14th
Blue Book has teamed with ProduceIQ BB #:368175 to bring the ProduceIQ Index to its readers. The index provides a produce industry price benchmark using 40 top commodities to provide data for decision making.
Meanwhile, strawberry prices continue their historic run. Average prices are up +15 percent over the previous week due to extremely tight supply.
Unfortunately for buyers, last week’s heavy rainfall has damaged the already fragile Western supply. Week #46 markets are at a 10-year high and could surpass 2015’s all-time high if prices maintain momentum. In other words, strawberries are firmly in their “don’t even think about bringing me to Thanksgiving dessert,” era.
Strawberries reach an all-time high, $32 and may remain scarce for a few weeks
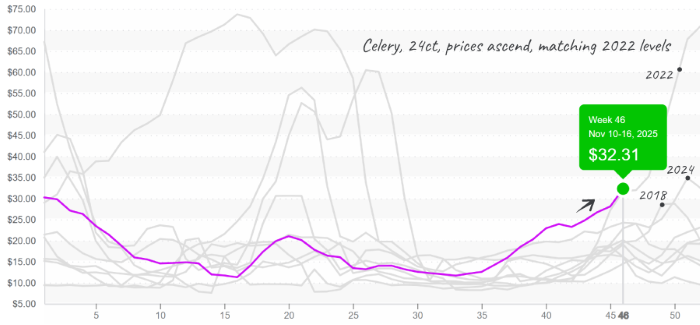
Adding to the holiday grocery drama, celery prices are up +30 percent over the previous week, continuing an eight-week streak. Average celery prices typically escalate through the year’s end due to holiday demand and decreasing supply.
But this year, prices are further provoked by inclement weather in California. Prices will likely continue to climb over the next two weeks as growers in Salinas, CA, work to pass the torch to growers in Southern California, just in time for every home cook to realize they’re out of celery again and make a mad dash to their grocer for the third time that day.
Celery prices climb steadily and are likely to continue into this volatile year-end season
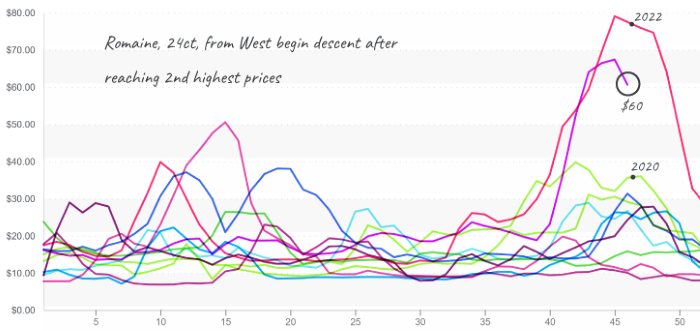
Low yields continue to drive lavish lettuce prices. Although average iceberg and romaine prices declined over the previous week, prices remain far above average for week #46. Increasing production from growers in Huron and Yuma, AZ, is easing supply tension. However, increasing holiday demand coupled with rapidly declining production in the Salinas/Watsonville areas has lettuce markets slated for a very bumpy transition. Perhaps this is the year we finally drop the salad course, since no one eats it anyway.
Buyers ease off, though still paying $60 for Romaine
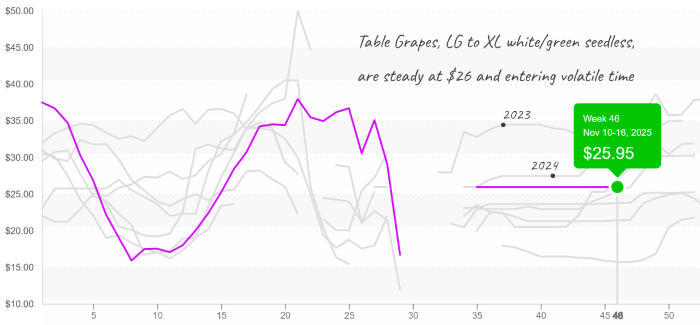
More rain is slated for grape growers in California, unfortunate news for all those who have enjoyed this fall’s unproblematic grape prices. Red and green grape prices are both elevated, but green supply will likely feel the impacts sooner than reds. We are entering the import season for grapes, and declining domestic production almost always prompts a period of price volatility.
This year, we may feel the transition more severely due to recent inclement weather in California’s growing regions. Call it one more reminder that even grapes aren’t immune to pre-holiday chaos.
Grapes have been flat, yet ready for a jump in prices
ProduceIQ saves you time and provides valuable information to increase your profits.
The ProduceIQ Index is the fresh produce industry’s only shipping point price index. It represents the industry-wide price per pound at the location of packing for domestic produce and at the port of U.S. entry for imported produce.
ProduceIQ uses 40 top commodities to represent the industry. The Index weights each commodity dynamically, by season, as a function of the weekly 5-year rolling average Sales. Sales are calculated using the USDA’s Agricultural Marketing Service for movement and price data. The Index serves as a fair benchmark for industry price performance.
News you need.
Join Blue Book today!
Get access to all the news and analysis you need to make the right decision --- delivered to your inbox.






Subscribe to our newsletter
© 2026 Blue Book Services. All Rights Reserved

