ProduceIQ: Markets stock gifts, coal and a few surprises
Despite the holiday pull, the ProduceIQ Index refuses to play Santa. Average prices slipped another -5 percent week over week.

Images courtesy ProduceIQ
An atmospheric river bound for the Pacific Northwest is expected to seep into key growing regions of Central and Southern California later this week.
While the system is welcome news for snow-hungry skiers, it’s far less ideal for fresh produce markets, with the potential to delay harvest schedules and trim yields.
Meanwhile, record warmth is delivering growers a very unseasonal gift. Christmas Day forecasts call for temperatures running up to 20 degrees above average from Yuma, AZ, to Plant City, FL. While the warmth favors cold-sensitive crops such as citrus and berries, it brings little Christmas cheer to heat-weary lettuce and wet vegetable markets already under pressure.
ProduceIQ Index: $1.04/pound, -5.0 percent over prior week
Week #51, ending Dec 19th
Blue Book has teamed with ProduceIQ BB #:368175 to bring the ProduceIQ Index to its readers. The index provides a produce industry price benchmark using 40 top commodities to provide data for decision making.
Despite the holiday pull, the ProduceIQ Index refuses to play Santa. Average prices slipped another -5 percent week over week, driven largely by heavily weighted stone fruit and berry markets. Still, elevated prices for holiday staples like celery, Brussels sprouts, and asparagus have some buyers holding out hope for a last-minute Christmas miracle.
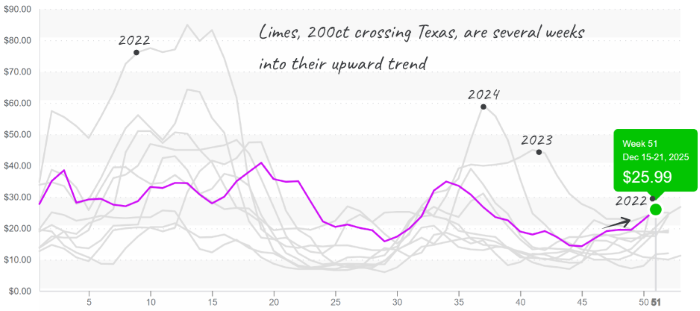
Against that backdrop, lime markets are closing out the year on a familiar but intensified note. In line with historical end-of-year trends, lime prices continue to rise. Unlike prior seasons, prices are averaging +$23, well above the ten-year average of +$17.
Strong holiday demand, crop rotation, and weather disruptions are combining to create a volatile finish to the year, with prices expected to continue climbing into the new year as seasonal volume declines.
Lime prices begin the climb towards a volatile winter season
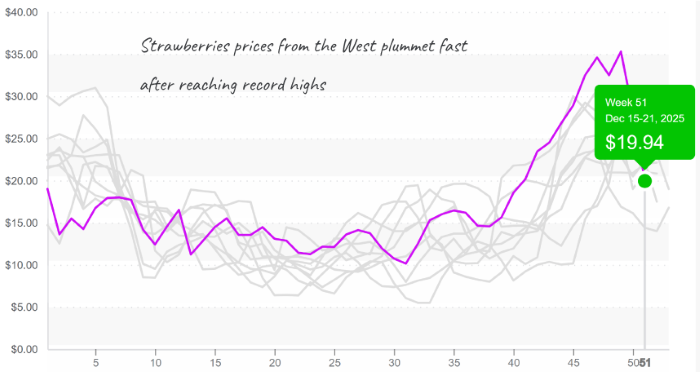
Strawberry markets, however, are delivering buyers a gift they didn’t expect. A major contributor to this week’s historically low index prices, strawberries plunged -43 percent from the previous week. Earlier rain brought a chaotic and premature end to the Salinas/Watsonville season, briefly driving prices to record highs. As production transitions south and volume rebounds, markets have corrected sharply, offering timely relief for holiday demand.
If only Week #49 could see markets now. By Week #52, prices are trending below average and are forecast to drift lower into the new year as ample supply from Florida and Mexico satisfies seasonal appetites. Still, uncertainty lingers, as the incoming atmospheric river could disrupt production in Oxnard, CA, and inject short-term volatility into otherwise favorable markets.
Strawberry prices descend fast, proving what goes up must come down
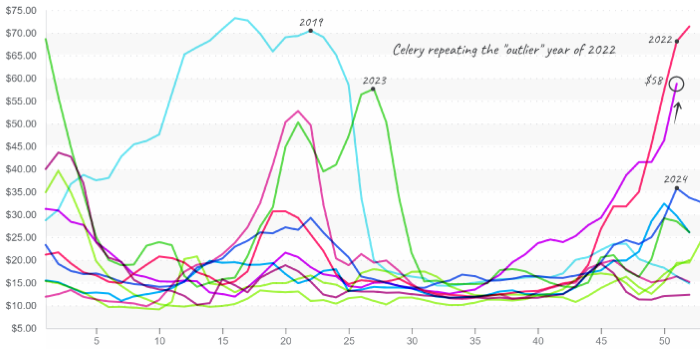
Celery continues to test buyers’ holiday budgets. In Week #51, prices surged another +29 percent week over week, remaining well above historical averages, though still shy of the ten-year high. With Yuma production not expected to ramp up until Week #1, growers in Oxnard and Santa Maria are working to bridge the supply gap. Lean supplies and elevated pricing are expected to persist through the turn of the calendar.
Celery prices may test the record prices set in 2022, which capped around $70
Rounding out the holiday spread, the import cherry season is well underway, with average prices sitting at a ten-year low. Week #51 volumes are notably higher than the five-year average, creating attractive promotional opportunities. That window may close quickly, however, as South American growers forecast tightening supplies as the U.S. moves into the latter half of the 2025/2026 import season.
ProduceIQ saves you time and provides valuable information to increase your profits.
The ProduceIQ Index is the fresh produce industry’s only shipping point price index. It represents the industry-wide price per pound at the location of packing for domestic produce and at the port of U.S. entry for imported produce.
ProduceIQ uses 40 top commodities to represent the industry. The Index weights each commodity dynamically, by season, as a function of the weekly 5-year rolling average Sales. Sales are calculated using the USDA’s Agricultural Marketing Service for movement and price data. The Index serves as a fair benchmark for industry price performance.

News you need.
Join Blue Book today!
Get access to all the news and analysis you need to make the right decision --- delivered to your inbox.


Subscribe to our newsletter
© 2026 Blue Book Services. All Rights Reserved

