


















DAT: Truckload freight market trends
Reefer spot market data for the end of August and ahead of Labor Day saw a climb of 9 cents to $3.54 a mile.
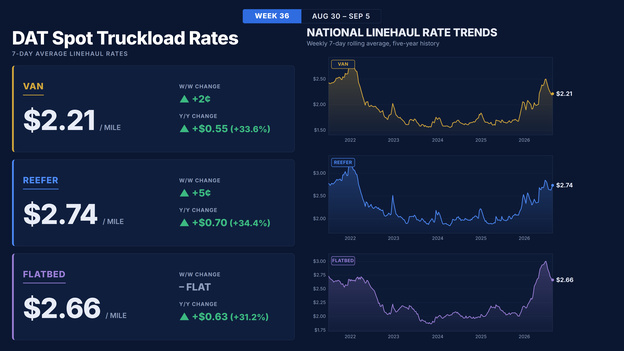
Spot market data for August 30 – September 5, 2026 (Week 36)- Reefer spot rate climbs 9 cents to $3.54 a mile ahead of Labor Day
Load posts on the DAT One load board totaled just under 3.0 million for the week of August 30 – September 5, down 3% from the prior week. Equipment posts were up 3% to 178,484, as trucks that left the market during the previous week’s CVSA inspection blitz began to return.
National average spot rates rose for all three equipment types for a second straight week, boosted by higher diesel prices: the EIA’s national average on-highway diesel price used in this week’s fuel surcharge calculation was $5.652 a gallon (week ending Aug. 24), up 19.8 cents (3.6%) from $5.454 the week before. Dry van and reefer linehaul rates also rose but did not keep pace with all-in rates.
7-day average broker-to-carrier spot rates (linehaul + fuel surcharge):
- Van: $2.95 per mile, up 6 cents
- Reefer: $3.54 per mile, up 9 cents
- Flatbed: $3.54 per mile, up 4 cents
Dry van: Demand held steady as capacity edged back into the spot market.
- Loads: 1,362,143, down 1%
- Trucks: 118,792, up 1%
- Linehaul rate: $2.21 per mile, up 2 cents
- Load-to-truck ratio: 11.5, down from 11.7 the prior week
Reefer: Capacity returned, but rates still gained.
- Loads: 778,579, down 1%
- Trucks: 36,228, up 5%
- Linehaul rate: $2.74 per mile, up 5 cents
- Load-to-truck ratio: 21.5, down from 22.8 the prior week
Flatbed: Freight pulled back the hardest of the three.
- Loads: 855,142, down 7%
- Trucks: 23,464, up 4%
- Linehaul rate: $2.66 per mile, essentially flat
- Load-to-truck ratio: 36.4, down from 40.9 the prior week
Market analysis from Dean Croke, industry analyst at DAT Freight & Analytics:
Capacity came back, but only some of it. Truck posts rose across all three equipment types for the first time in weeks as carriers returned to the spot market ahead of Labor Day. Reefer capacity returned fastest at 5.3%, followed by flatbed at 4.1% and van at 1.4%. Even so, truck availability is down double digits from last year for every equipment type: 17.2% for van, 18.7% for reefer, and 11.0% for flatbed. At 178,484, total equipment posts were still the lowest Week 36 figure in DAT’s records.
Spot rates still held near their highs. The national average van linehaul rate rose 2 cents to $2.21 per mile. Reefer increased 5 cents to $2.74, while flatbed finished within a cent of the prior week at $2.66. Load-to-truck ratios loosened as trucks returned, but they remain far tighter than a year ago: 11.5 against 6.7 for van, 21.5 against 10.2 for reefer, and 36.4 against 22.2 for flatbed. This is still a supply-led market.
Fuel added to every all-in rate. Diesel rose 19.8 cents a gallon, the second large weekly increase in a row and about 40 cents over the two weeks. That added roughly 3 cents a mile to the average broker-to-carrier van spot rate, 4 cents to reefer, and 4 cents to flatbed. Fuel accounted for more than half the van increase, and for all of flatbed’s, whose linehaul rate was unchanged.
Rates sit at the top of their range. The national average van linehaul rate is up 34% year over year, reefer 34%, and flatbed 31%, and all three sit near the top of the nine-year seasonal range. The 35-day DAT iQ RateCast forecast puts van linehaul at $2.20 a mile in mid-October, reefer at $2.68, and flatbed at $2.63, landing 53, 60, and 57 cents above where the same rates actually sat a year ago (a weak year for spot rates).
About DAT Freight & Analytics – DAT Freight & Analytics operates DAT One, North America’s largest truckload freight marketplace; DAT iQ, the industry’s leading freight data analytics service; the Convoy Platform automated freight-matching service; Trucker Tools, the leader in load visibility; and DAT Outgo, the financial services platform for truckers.
Listen to Dean Croke’s latest DAT iQ Market Update at dat.com/podcast/iqmarketupdate.
Load and truck posts refer to the number of posts on the DAT One marketplace during Week 36 (Aug. 30–Sep. 5). Load volume represents the number of loads moved. Rates are aggregated from invoice data submitted to DAT iQ. Broker-to-carrier rates reflect an average linehaul rate plus an equipment-specific fuel surcharge calculated using the latest weekly average on-highway diesel price reported by the EIA.

News you need.
Join Blue Book today!
Get access to all the news and analysis you need to make the right decision --- delivered to your inbox.






Subscribe to our newsletter
© 2026 Blue Book Services. All Rights Reserved

