


















DAT: Spot load posts dipped 5 percent last week
Despite the decrease in load posts during the week of Nov. 8-14, shippers are positioning goods ahead of the holidays.

Load posts on DAT One fell 5 percent to 2.04 million during the week of Nov. 8-14 (Week 46). Despite the decrease, the number of available loads has been above 2 million for 10 consecutive weeks as shippers position goods ahead of the holidays. The total number of truck posts slipped 1 percent to 251,080.
Freight trends from DAT One and DAT iQ: Spot market data for Nov. 8-14, 2025 (Week 46)
Broker-to-carrier 7-day average spot rates
▼ Dry van: $2.04 per mile, down 2 cents week over week
— Refrigerated: $2.45 per mile, unchanged
▼ Flatbed: $2.38 per mile, down 3 cents
Dry van
▼ Van loads: 951,829, down 4 percent week over week
▼ Van equipment: 176,207, down 1 percent
▼ Linehaul rate: $1.68 per mile, down 1 cent
Reefer
▼ Reefer loads: 510,783, down 1 percent week over week
▼ Reefer equipment: 43,458, down 2 percent
▼ Linehaul rate: $2.08 per mile, down 1 cent
Flatbed
▼ Flatbed loads: 576,588, down 12 percent week over week
▼ Flatbed equipment: 31,415, down 1 percent
▼ Linehaul rate: $2.04 per mile, down 2 cents
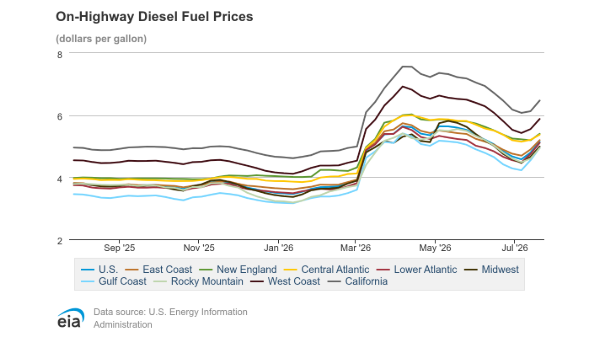
U.S. National Average Diesel Price (Source: EIA)
▲ $3.84 per gallon, up 9 cents week over week (ending Nov. 10). ▲ 32 cents YOY
Market notes from Dean Croke, DAT iQ industry analyst:
Year-over-year posting totals show the current contrast of this year’s spot market: The number of loads posted to DAT One during Week 46 was 21 percent higher year over year while the number of trucks on the network was 26 percent lower. Reefer truck posts were down 39 percent compared to last year, and dry van truck posts down 21 percent. Flatbed load posts were 12 percent lower year over year, while flatbed equipment posts were virtually unchanged.
While dry van load and equipment posts were relatively stable nationwide, some major regional markets saw increases. On the West Coast, Stockton and Ontario reported 5 percent and 7 percent increases in load post volumes, respectively. Similarly, markets in the Carolinas saw about a 5 percent increase in load-post volumes.
DAT’s top 50 van lanes by load volume averaged $1.97 per mile last week, down 3 cents week over week but 29 cents higher than the national 7-day rolling average spot rate. In the 13 key Midwest states, which represent 45 percent of national load volume and often indicate future national trends, the average spot van rate decreased by 3 cents to $1.91 per mile. That’s 23 cents higher than the national 7-day rolling average.
A surge in load posts led to tight reefer capacity across the West from Nogales, Arizona, to Medford, Oregon. Reefer load post volumes in the West spiked by 34 percent last week and are up 41 percent during the previous four weeks. In Fresno, the largest produce market in California, load posts were up 40 percent last week and 70 percent in the last month.
In DAT’s Miami market, reefer load posts increased 19 percent week over week and were up 40 percent over the last month, driven by long-haul lanes to markets across the South and Northeast. Citrus, leafy greens, and berries are beginning to move, including the initial strawberry crops from the Plant City area.
Last week, the national average flatbed spot rate experienced the largest single-week drop since the start of August, falling 4 cents to a national average of $2.01 per mile. The rate is still 5 cents per mile higher than last year.
About DAT Freight & Analytics
DAT Freight & Analytics operates DAT One, North America’s largest truckload freight marketplace; DAT iQ, the industry’s leading freight data analytics service; the Convoy Platform automated freight-matching service; Trucker Tools, the leader in load visibility; and Outgo, the financial services platform for truckers. Check out the latest DAT iQ Market Update every Tuesday or on demand: Flatbed: It’s Not for Everyone
Load and truck posts refer to the number of posts on the DAT One marketplace during Week 46 (Nov. 8-14). Load volume refers to the number of loads moved. Rates are aggregated from invoice data submitted to DAT iQ. dat.com

News you need.
Join Blue Book today!
Get access to all the news and analysis you need to make the right decision --- delivered to your inbox.





Subscribe to our newsletter
© 2026 Blue Book Services. All Rights Reserved

