


















DAT: Holiday-week capacity crunch drives spot rates higher
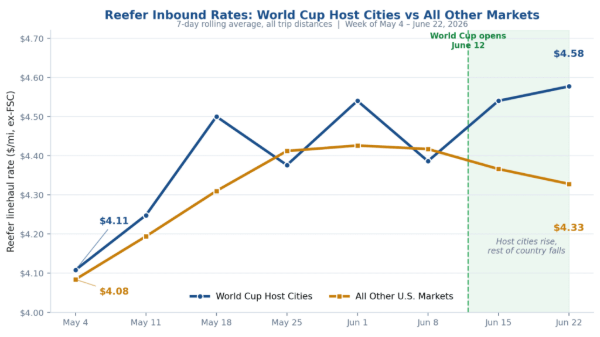
Load post volumes last week remained 35 percent above year-ago levels, and summer produce keeps reefer rates strong.
Courtesy DAT
Total load posts on DAT One fell to 2.72 million last week, down 27% from the prior week, as freight movement slowed ahead of Independence Day.
However, load post volumes last week remained approximately 35% above year-ago levels. Equipment posts fell 14% to 157,422 as carriers took time off for the holiday. Even so, capacity remained tight relative to demand, and spot linehaul rates rose 3 to 10 cents per mile across all three equipment types.
Lower diesel prices pulled fuel surcharges down 3 cents per mile, partially offsetting gains in broker-to-carrier all-in rates.
Spot market data for June 28–July 4, 2026 (Week 27)
7-day average broker-to-carrier spot rates (linehaul + FSC):
▲ Dry van: $3.06 per mile, up 4 cents week over week
▲ Refrigerated: $3.47 per mile, up 7 cents
▲ Flatbed: $3.68 per mile, unchanged
Van: Posting volumes drop, but rates climb
▼ Van loads: 1,182,988, down 27% week over week
▼ Van equipment: 105,992, down 16%
▲ Linehaul rate: $2.49 per mile, up 7 cents week over week
▼ Load-to-truck ratio: 11.2, down from 12.8 the prior week
Reefer: Produce season keeps rates strong
▼ Reefer loads: 717,866, down 17% week over week
▼ Reefer equipment: 32,538, down 8%
▲ Linehaul rate: $2.85 per mile, up 10 cents week over week
▼ Load-to-truck ratio: 22.1, down from 24.3
Flatbed: Linehaul rate approaches $3.00
▼ Flatbed loads: 814,552, down 35% week over week
▼ Flatbed equipment: 18,892, down 14%
▲ Linehaul rate: $2.99 per mile, up 3 cents
▼ Load-to-truck ratio: 43.1, down from 57.0
Market analysis from Dean Croke, Industry Analyst, DAT Freight & Analytics
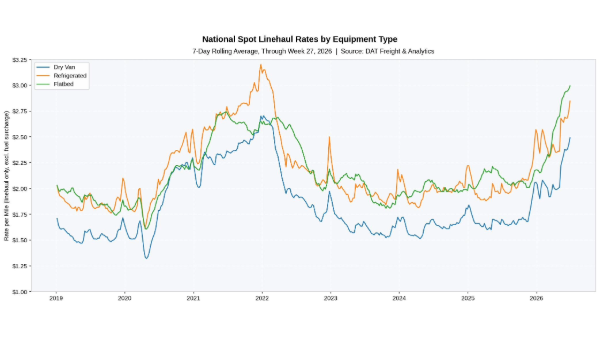
The national average reefer linehaul rate rose 10 cents to $2.85 per mile, matching the 2021 all-time record. The average all-in broker-to-carrier spot rate jumped 7 cents to $3.47 per mile. The market to move fresh and frozen produce and other temperature-controlled freight remained robust into the July 4 weekend. Several trends stand out:
- Since mid-April, the national average reefer linehaul rate has increased 50 cents per mile, more than double the 10-year seasonal average gain of 23 cents.
- The national average linehaul rate is 39% (80 cents) higher year over year and 28% (78 cents) above the non-pandemic five-year norm.
- Reefer load post volumes decreased by 17% during the shortened workweek, yet they were 32% above the previous year’s levels.
Van linehaul climbed 7 cents to a Week 27 record of $2.49 per mile, 10 cents above the 2021 pandemic-era peak. The national average was 49% (82 cents) higher year over year and 31% (77 cents) above the five-year average. The rate has increased by 24% (49 cents) since the week before the CVSA International Roadcheck inspection event, held May 12–14.
On DAT’s top 50 lanes by volume, the average van linehaul rate jumped 13 cents to $3.06 per mile. The average rate in the country’s 10-state manufacturing core—Indiana, Illinois, Kentucky, Tennessee, Ohio, Missouri, North Carolina, Virginia, Michigan, and Mississippi—gained 13 cents to average $2.98 per mile. This increase reflects tighter truck capacity during the abbreviated workweek preceding Independence Day.
Flatbed linehaul climbed 3 cents to $2.99 per mile, closing in on the $3.00 mark as the market transitions through the July 4 holiday. The rate sits about 42% higher year over year, sustained by infrastructure and manufacturing backlogs across the 10-state industrial corridor. Flatbed appears to be entering its typical post-July 4 seasonal plateau while remaining above historical norms. The weekly rate has increased for 16 consecutive weeks, rising from $2.31 to $2.99 or 68 cents, since early March.
Fuel surcharges by equipment type this week: Dry van 57 cents per mile, refrigerated 62 cents, flatbed 68 cents. All three declined about 3 cents week over week as the national average on-highway diesel price dropped by 16 cents to $4.67 a gallon.
About DAT Freight & Analytics
DAT Freight & Analytics operates DAT One, North America’s largest truckload freight marketplace; DAT iQ, the industry’s leading freight data analytics service; the Convoy Platform automated freight-matching service; Trucker Tools, the leader in load visibility; and Outgo, the financial services platform for truckers. Listen to Dean Croke’s latest DAT iQ Market Update at https://www.dat.com/podcast/iqmarketupdate.
Load and truck posts refer to the number of posts on the DAT One marketplace during Week 27 (June 28–July 4). Load volume refers to the number of loads moved. Rates are aggregated from invoice data submitted to DAT iQ. All-in broker-to-carrier rates reflect a linehaul rate plus an equipment-specific fuel surcharge calculated from the latest weekly average on-highway diesel price as reported by EIA.
Contact:
Stephen Petit, SiefkesPetit Communications, 425-443-8976

News you need.
Join Blue Book today!
Get access to all the news and analysis you need to make the right decision --- delivered to your inbox.





Subscribe to our newsletter
© 2026 Blue Book Services. All Rights Reserved

