



















Even as diesel drops, linehaul rates remain one-third higher than last year
A lower diesel price took about 1 cent off the estimated fuel surcharge, which accounted for about two-thirds of the flatbed decline.
Courtesy DAT
DAT One load posts totaled 2.70 million for the week of Nov. 7-13, down 6% from the prior week. Total equipment posts rose 9% to 187,501. Spot linehaul rates rose 5 cents a mile for van and reefer, and flatbed was essentially flat. Broker-to-carrier spot rates rose 4 cents for van and reefer and fell 2 cents for flatbed.
A lower diesel price took about 1 cent off the estimated fuel surcharge for all three, which accounted for about two-thirds of the flatbed decline.
Spot truckload market data for Nov. 7-13, 2026 (Week 46)
DAT One and DAT iQ
7-day average broker-to-carrier spot rates (linehaul + fuel surcharge):
▲ Van: $3.11 per mile, up 4 cents
▲ Reefer: $3.70 per mile, up 4 cents
▼ Flatbed: $3.61 per mile, down 2 cents
Dry van: Truck posts rose 9% while load posts eased.
▼ Loads: 1,199,287, down 5%
▲ Trucks: 125,511, up 9%
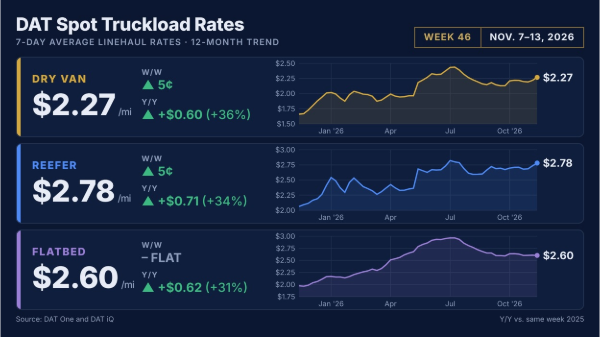
▲ Linehaul rate: $2.27 per mile, up 5 cents
▼ Load-to-truck ratio: 9.6, down from 10.9 the prior week
Reefer: Truck posts grew faster than loads ahead of Thanksgiving.
▲ Loads: 640,643, up 1%
▲ Trucks: 36,302, up 9%
▲ Linehaul rate: $2.78 per mile, up 5 cents
▼ Load-to-truck ratio: 17.7, down from 19.0 the prior week
Flatbed: Fewer loads and more trucks cut the ratio by nearly 9 points.
▼ Loads: 856,392, down 11%
▲ Trucks: 25,688, up 12%
— Linehaul rate: $2.60 per mile, essentially flat
▼ Load-to-truck ratio: 33.3, down from 42.3 the prior week
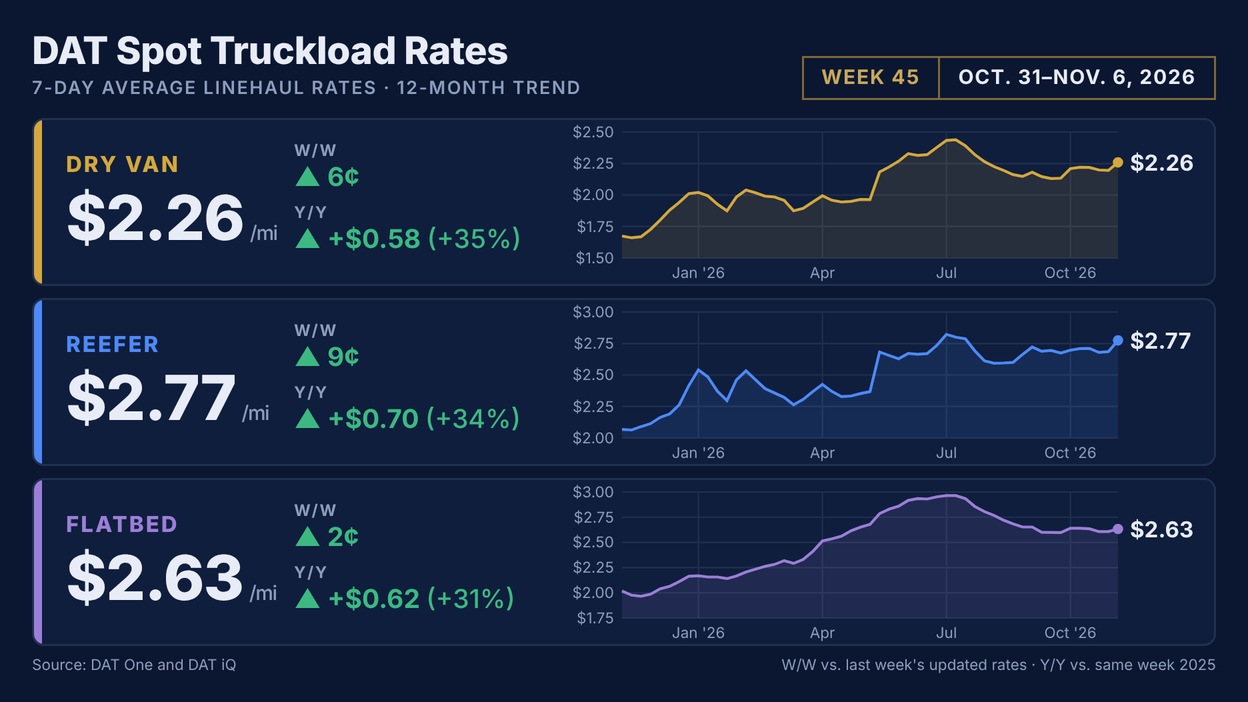
Note: Rates can change later as DAT iQ receives more of the week’s invoices. This week’s changes compare with last week’s updated rates: dry van $2.22, reefer $2.74, and flatbed $2.61 per mile, down from the $2.26, $2.77, and $2.63 first reported.
Market analysis from Dean Croke, industry analyst at DAT Freight & Analytics
Linehaul rates are about a third more than last year. Linehaul rates are 36% above last year for van, 34% for reefer, and 31% for flatbed, against a 2025 market that was still in a freight recession. Against their nine-year seasonal averages, rates are 25% higher for van, 28% for reefer, and 27% for flatbed. The 35-day DAT iQ RateCast forecast has van linehaul rising to $2.36 a mile by Dec. 17, reefer holding near $2.79, and flatbed edging up to $2.64.
Dry van rates are back at 2020 levels, and flatbed rates at 2021 levels. Over the eight weeks ending Nov. 13, dry van linehaul averaged $2.20 a mile, the same as the matching weeks of 2020, and no week sat more than 2% from its 2020 match. Flatbed averaged $2.62, the same as 2021. Reefer averaged $2.71, which is 5% below 2021 and 14% above 2020.
The supply side looks different this time. Over the same eight weeks, van truck posts are 52% below 2020 and 56% below 2021, while van load posts are 9% above 2020. Flatbed is the exception: load posts are down 49% from 2021 while truck posts are down 38%, and its load-to-truck ratio of 38.3 sits below the 2021 level of 46.3.
Winter lettuce is moving to the desert. According to USDA, produce volume fell 17% from the prior week and is 17% below a year ago, led by a 21% drop in Texas and a 16% drop in California. Rates did not follow volume down. USDA produce spot rates averaged $3.94 a mile for the week ending Nov. 10, up 43% from a year ago on lanes published in both years.
Imperial and Coachella romaine volume jumped 110% and iceberg 195%, while Salinas-Watsonville volume fell 30%. Lettuce production is shifting from Salinas to the desert growing region of Southern California and southwestern Arizona, including the Imperial and Coachella valleys and Yuma, Ariz. The Yuma area supplies about 90% of leafy greens in winter. USDA rates reflect what shippers or receivers pay, including broker fees.
California posted the widest year-over-year gain among van origins. California’s dry van rate rose 4 cents to $2.81 a mile, 98 cents (54%) above last year, the widest gain among the top 10 origin regions. Its reefer rate also rose 4 cents, to $2.95. Upper Midwest had the highest reefer rate among the top origin regions at $3.62, up 6 cents, while Ohio River reefer fell 14 cents to $3.05.
Year-over-year gains should narrow after Thanksgiving. Thanksgiving falls on Nov. 26, and dry van and reefer spot rates typically build into the holiday weeks. Last year, rates started climbing right after Thanksgiving, so the year-over-year gap is likely to narrow in early December even if rates hold.
What to watch this week:
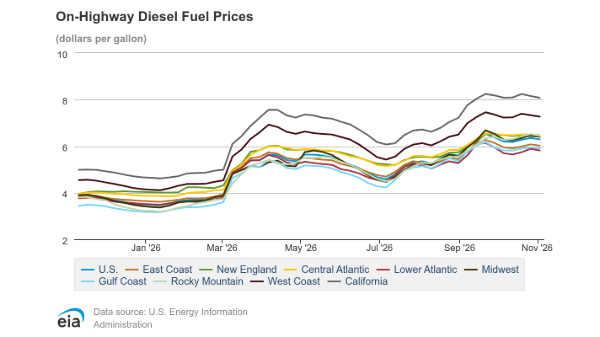
Fuel: This report’s fuel surcharge uses the EIA’s $6.292-a-gallon national average for the week of Nov. 2, down 6 cents. The EIA reported $6.127 for the week of Nov. 9, down 16.5 cents and marking a second straight weekly decline. That figure feeds next week’s surcharge and takes about 3 cents per mile off all three equipment types. In its Short-Term Energy Outlook, released Nov. 10, the EIA raised its 2027 diesel forecast to $5.03 a gallon from $4.49, citing tight global fuel supplies.
Economic reports: October retail sales will be released Tuesday, Nov. 17, and October housing starts will follow Wednesday, Nov. 18.
About DAT Freight & Analytics
DAT Freight & Analytics operates the DAT One truckload freight marketplace; DAT iQ analytics service; Convoy Platform, an automated freight-matching technology; Trucker Tools load-visibility platform; and DAT Outgo factoring and financial services for truckers. Shippers, transportation brokers, carriers, news organizations, and industry analysts rely on DAT for market trends and data insights, informed by over 700,000 daily load posts and a database exceeding $1 trillion in freight market transactions.
Listen to Dean Croke’s latest DAT iQ Market Update at dat.com/podcast/iqmarketupdate.
Load and truck posts refer to the number of posts on the DAT One marketplace during Week 46 (Nov. 7-13). Rates are aggregated from invoice data submitted to DAT iQ. Broker-to-carrier rates reflect an average linehaul rate plus an equipment-specific fuel surcharge calculated using the EIA’s weekly average on-highway diesel price from the Monday before the report week.

News you need.
Join Blue Book today!
Get access to all the news and analysis you need to make the right decision --- delivered to your inbox.






Subscribe to our newsletter
© 2026 Blue Book Services. All Rights Reserved

