



















DAT truckload freight trends from DAT One and DAT iQ
The latest spot market data for October 31 through November 6, 2026, shows fluctuating rates ahead of the holiday season.
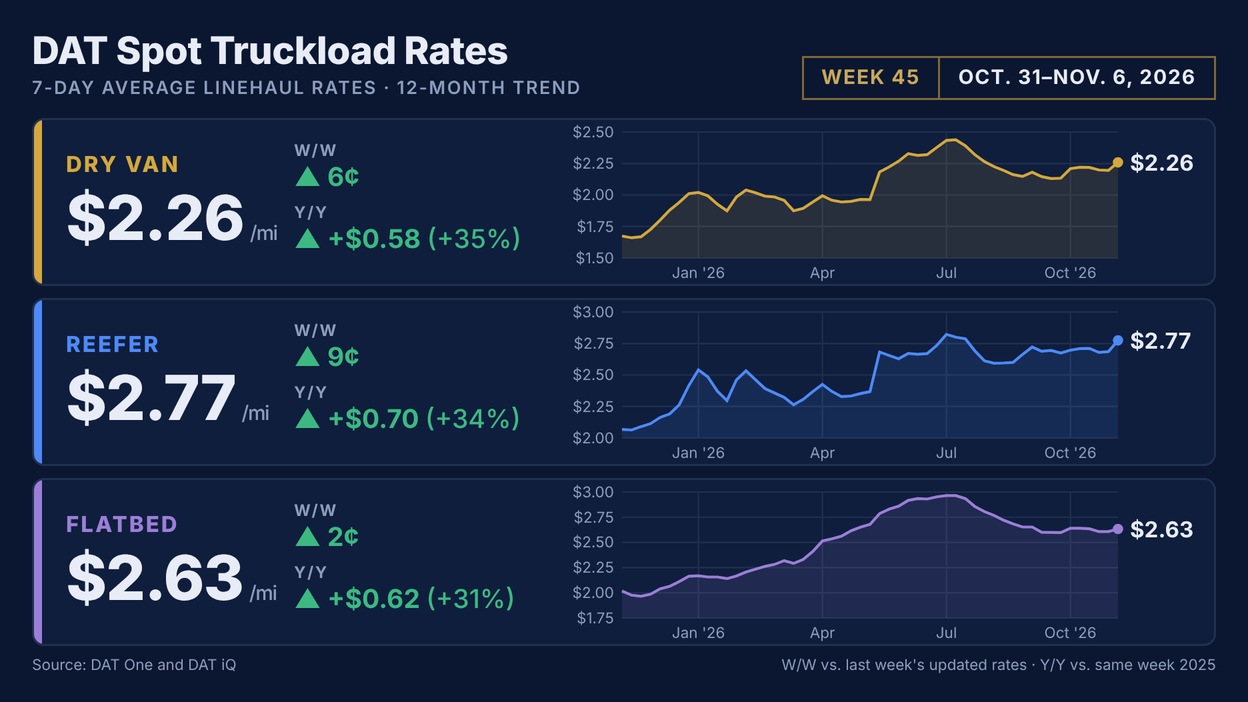
Reefer spot rate climbs 10 cents to $3.70 a mile as holiday freight starts moving. DAT One load posts totaled 2.85 million for the week of Oct. 31-Nov. 6, up 4% from the prior week. Total equipment posts fell 2% to 171,389.
Spot linehaul rates rose 2 to 9 cents a mile, and broker-to-carrier spot rates rose 4 to 10 cents. Linehaul drove most of the increase across all three equipment types, while higher diesel prices added 1 to 2 cents to the fuel surcharge.
7-day average broker-to-carrier spot rates (linehaul + fuel surcharge):
▲ Van: $3.11 per mile, up 7 cents
▲ Reefer: $3.70 per mile, up 10 cents
▲ Flatbed: $3.65 per mile, up 4 cents
Dry Van: Loads and trucks both slipped 2%.
▼ Loads: 1,257,623, down 2%
▼ Trucks: 115,330, down 2%
▲ Linehaul rate: $2.26 per mile, up 6 cents
— Load-to-truck ratio: 10.9, unchanged from the prior week
Reefer: Load posts jumped 16%, the biggest gain of the three.
▲ Loads: 631,561, up 16%
▼ Trucks: 33,218, down 4%
▲ Linehaul rate: $2.77 per mile, up 9 cents
▲ Load-to-truck ratio: 19.0, up from 15.7 the prior week
Flatbed: More loads and more trucks nudged the ratio up.
▲ Loads: 965,338, up 5%
▲ Trucks: 22,841, up 3%
▲ Linehaul rate: $2.63 per mile, up 2 cents
▲ Load-to-truck ratio: 42.3, up from 41.7 the prior week
Note: Rates can change later as DAT iQ receives more of the week’s invoices. This week’s changes compare with last week’s updated rates: dry van $2.20 and reefer $2.69 per mile, down from the $2.23 and $2.71 first reported. Flatbed held at $2.61.
Market analysis from Dean Croke, industry analyst at DAT Freight & Analytics
The calendar adds to a tight truck supply. Truck posts on DAT One are 24% to 34% below a year ago, while load posts are 22% to 47% higher. Holiday retail freight and food are moving as holiday restocking draws freight out of distribution centers. Christmas tree loads out of Oregon are under way, and shippers are working to clear their docks ahead of the holiday week. The 35-day DAT iQ RateCast forecast has van linehaul rising to $2.32 a mile by mid-December. Reefer is forecast to ease to $2.76 and flatbed to edge up to $2.64.
Reefer freight had a big week. The reefer load-to-truck ratio jumped to 19.0 from 15.7 as load posts rose 16% and truck posts fell 4%. Reefer linehaul gained 9 cents, the largest increase of the three equipment types.
Trucks are tight for Northwest apples and California citrus. The USDA’s Nov. 3 truck rate report rated truck availability as adequate in most produce shipping areas, with slight shortages for apples and pears out of Washington’s Yakima Valley and Wenatchee district and for citrus from South and Central California. Rates ran $12,900 to $13,800 a load to move Washington apples and pears to Miami.
Mexican produce crossing through South Texas was the only area with a slight truck surplus. Fresh produce volume totaled about 42,500 truckloads for the week ending Oct. 31, down 3% from the prior week and 3% from a year ago, as imports fell 7% while domestic volume held about even. The winter vegetable harvest around Yuma, Ariz., and South American imports through Philadelphia should start soon. USDA rates reflect what shippers or receivers pay, including broker fees.
Van and reefer rates trail only 2021 for early November. Linehaul rates are 35% above last year for van, 34% for reefer, and 31% for flatbed, and 23% to 28% above their nine-year seasonal averages. Van and reefer sit higher than every year in the nine-year range except 2021. Flatbed is above the top of the range, and its load-to-truck ratio of 42.3 is nearly double last year’s 21.1.
Fuel is widening the gap between linehaul and the all-in rate. The fuel surcharge portion of the dry van spot rate is now 85 cents a mile, up from 37 cents in mid-January and above the 2022 peak of 76 cents. Of the $1.02-a-mile increase in the all-in van rate from a year ago, 44 cents came from fuel, and fuel now accounts for 27% of the all-in rate, up from 16% at the start of the year. Diesel has fallen between early November and the end of December in seven of the past 11 years, by a median of about 11 cents a gallon, which would take about 2 cents a mile off the fuel portion.
What to watch this week:
Fuel: This report’s fuel surcharge calculation uses the EIA’s $6.352-a-gallon national average for the week of Oct. 26, up 7.6 cents. The EIA reported $6.292 for the week of Nov. 2, down 6 cents and its first decline in three weeks. That figure feeds next week’s surcharge and takes about 1 cent a mile off all three equipment types. The EIA’s November Short-Term Energy Outlook comes out Tuesday, Nov. 10. Its October edition expected diesel to average about $4.50 a gallon in 2027.
Economic reports: The October consumer price index comes out Tuesday, Nov. 10, followed by the producer price index on Friday, Nov. 13, and October retail sales on Tuesday, Nov. 17. Last week’s October jobs report showed truck transportation employment unchanged from September at 1.47 million, according to the Bureau of Labor Statistics.
California capacity during Diwali: Diwali, the five-day Festival of Lights, peaks on Sunday, Nov. 8. Many Punjabi Sikh drivers, who own or drive a large share of California’s trucks, take the week off to celebrate with family. That typically tightens truck capacity across the state, especially for long-haul reefer loads, and Stockton is one of the markets most affected. California was already moving up last week. Its reefer rate rose 15 cents to $2.91 a mile, and its dry van rate rose 15 cents to $2.77, the largest dry van gain among the top origin regions.
About DAT Freight & Analytics – DAT Freight & Analytics operates the DAT One truckload freight marketplace; DAT iQ analytics service; Convoy Platform, an automated freight-matching technology; Trucker Tools load-visibility platform; and DAT Outgo factoring and financial services for truckers. Shippers, transportation brokers, carriers, news organizations, and industry analysts rely on DAT for market trends and data insights, informed by over 700,000 daily load posts and a database exceeding $1 trillion in freight market transactions.
Listen to Dean Croke’s latest DAT iQ Market Update at dat.com/podcast/iqmarketupdate.
Load and truck posts refer to the number of posts on the DAT One marketplace during Week 45 (Oct. 31-Nov. 6). Rates are aggregated from invoice data submitted to DAT iQ. Broker-to-carrier rates reflect an average linehaul rate plus an equipment-specific fuel surcharge calculated using the EIA’s weekly average on-highway diesel price from the Monday before the report week.

News you need.
Join Blue Book today!
Get access to all the news and analysis you need to make the right decision --- delivered to your inbox.






Subscribe to our newsletter
© 2026 Blue Book Services. All Rights Reserved

