


















Freight volumes rebound after Independence Day
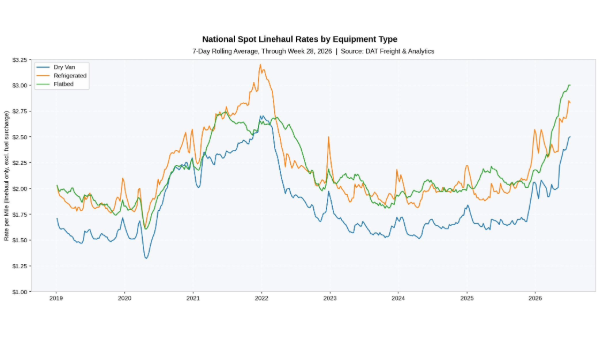
The national average reefer linehaul rate began its post-July 4 cooldown, but the average reefer linehaul rate remains above year-ago levels.
Courtesy DAT
Total load posts on DAT One climbed to 3.34 million last week, up 22% from the prior week, as freight movement resumed after the Independence Day holiday. Equipment posts rose 6% to 173,347.
The imbalance tightened load-to-truck ratios across all three equipment types. Changes in spot linehaul rates were mixed, with the national average flatbed rate topping $3.00 for the first time. Lower diesel prices pulled fuel surcharges down 2 cents per mile across the board.
Spot market data for July 5–11, 2026 (Week 28)
7-day average broker-to-carrier spot rates (linehaul + FSC):
▼ Dry van: $3.05 per mile, down 1 cent week over week
▼ Refrigerated: $3.43 per mile, down 3 cents
▼ Flatbed: $3.67 per mile, down 1 cent
Van: Demand rebounds, linehaul holds
▲ Van loads: 1,441,301, up 21% week over week
▲ Van equipment: 118,971, up 8%
▲ Linehaul rate: $2.50 per mile, up 1 cent week over week
▲ Load-to-truck ratio: 12.1, up from 10.8 the prior week
Reefer: Loads climb, linehaul dips
▲ Reefer loads: 795,896, up 10% week over week
▼ Reefer equipment: 33,728, down 2%
▼ Linehaul rate: $2.83 per mile, down 2 cents week over week
▲ Load-to-truck ratio: 23.6, up from 21.1
Flatbed: Historic milestone
▲ Flatbed loads: 1,100,989, up 35% week over week
▲ Flatbed equipment: 20,648, up 7%
▲ Linehaul rate: $3.00 per mile, up 1 cent
▲ Load-to-truck ratio: 53.3, up from 42.2
Market analysis from Dean Croke, Industry Analyst, DAT Freight & Analytics
The national average flatbed linehaul rate increased marginally, extending the streak of consecutive weekly increases to 17 weeks. Since the run began in early March, the weekly average flatbed linehaul rate has increased by 69 cents per mile.
Every equipment type saw load-to-truck ratios increase, with flatbed’s LTR jumping from 42.2 to 53.3, driven by a 35% surge in load posts.
The national average reefer linehaul rate began its post-July 4 cooldown. Despite last week’s 2-cent decline, the average reefer linehaul rate remains well above year-ago levels. The softening likely reflects the mid-summer produce-season transition as early crops wind down before Midwest and Northwest harvests reach peak volume.
Van rates from the country’s manufacturing core increased. The average outbound van linehaul rate from Indiana, Illinois, Kentucky, Tennessee, Ohio, Missouri, North Carolina, Virginia, Michigan, and Mississippi increased 7 cents to $3.05 per mile. This region generates 40% of the nation’s van freight volume.
Reefer rates from the country’s food-production core bucked the trend. The average outbound reefer linehaul rate from Indiana, Illinois, Texas, Ohio, Tennessee, Wisconsin, Arkansas, Kentucky, Missouri, and Pennsylvania increased 13 cents to $3.36 per mile. This region accounts for 43% of the nation’s reefer freight volume. Unlike seasonal produce hubs, these states generate year-round staples including dairy, poultry, and processed foods, providing a more consistent barometer of the national reefer market.
California outbound reefer linehaul rates averaged $3.69 per mile. That’s up 50% ($1.22 per mile) over last year, while volumes were 10% lower.
Lower diesel prices continued to trim fuel surcharges. The latest average price of on-highway diesel fell 9 cents to $4.58 per gallon, pulling fuel surcharge amounts down 2 cents per mile across all three equipment types, to 55 cents for dry van, 61 cents for refrigerated, and 67 cents for flatbed loads.
About DAT Freight & Analytics
DAT Freight & Analytics operates DAT One, North America’s largest truckload freight marketplace; DAT iQ, the industry’s leading freight data analytics service; the Convoy Platform automated freight-matching service; Trucker Tools, the leader in load visibility; and DAT Outgo, the financial services platform for truckers. Listen to Dean Croke’s latest DAT iQ Market Update at https://www.dat.com/podcast/iqmarketupdate.
Load and truck posts refer to the number of posts on the DAT One marketplace during Week 28 (July 5–11). Load volume represents the number of loads moved. Rates are aggregated from invoice data submitted to DAT iQ. Broker-to-carrier rates reflect an average linehaul rate plus an equipment-specific fuel surcharge calculated from the latest weekly average on-highway diesel price as reported by the EIA.
Contact:
Stephen Petit
SiefkesPetit Communications
425-443-8976

News you need.
Join Blue Book today!
Get access to all the news and analysis you need to make the right decision --- delivered to your inbox.




Subscribe to our newsletter
© 2026 Blue Book Services. All Rights Reserved

