Freight spot rates jump as weather and holidays push demand for trucks
The combination of winter weather and the repositioning of groceries for the holidays increased demand for trucks and pushed up spot rates.

At 3.0 million, load posts on DAT One were 10% lower than the previous week but still the second-highest weekly total this year.
The number of truck posts rose 3% to 256,617 on greater dry van availability. The combination of winter weather across much of the country and the repositioning of groceries and retail goods for the holidays increased demand for trucks and pushed spot rates higher.
Weekly national averages, Dec. 7-13, 2025 – Week 50
Broker-to-carrier 7-day average spot rates:
▲ Dry van: $2.26 per mile, up 8 cents week over week
▲ Refrigerated: $2.57 per mile, up 2 cents
▲ Flatbed: $2.44 per mile, up 2 cents
Dry van
▼ Van loads: 1.5 million, down 9% week over week
▲ Van equipment: 180,967, up 5%
▲ Linehaul rate: $1.89 per mile, up 8 cents
Reefer
▼ Reefer loads: 686,774, down 16% week over week
▼ Reefer equipment: 46,673, down 1%
▲ Linehaul rate: $2.21 per mile, up 3 cents
Flatbed
▼ Flatbed loads: 772,879, down 7% week over week
▼ Flatbed equipment: 28,977, down 2%
▲ Linehaul rate: $2.07 per mile, up 2 cents
U.S. National Average Diesel Price (Source: EIA)
▼ $3.61 per gallon, down 6 cents week over week (ending Dec. 15). ▲ 12 cents YOY
Analysis from Dean Croke, Industry Analyst, DAT Freight & Analytics
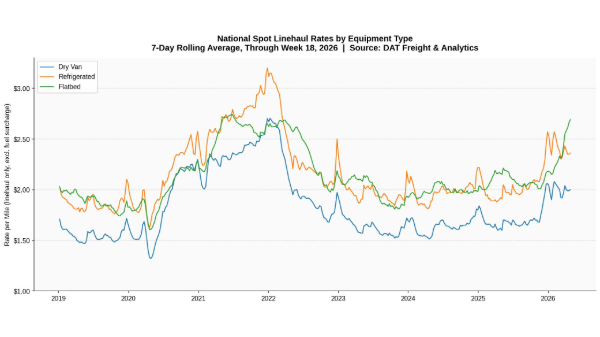
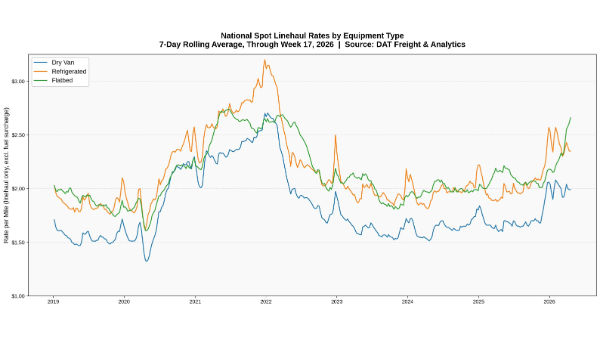
Dry van spot rates surged as winter storms made travel difficult and pushed freight to brokers and the DAT One load board. The national average weekly van spot rate has increased by 13% over the past month, climbing about 7 cents per mile each of the last three weeks.
Spot rates for Week 50 were the highest outside of the pandemic years (2020-2021) across all three major equipment types, highlighting how quickly short-term shocks can strain an already fragile capacity environment.
Looking ahead, DAT Ratecast predicts the national average weekly van spot rate to increase by another 20 cents per mile by New Year’s. This would represent a 25% rise in spot rates from early November through year-end, assuming no severe weather and a typical late-December capacity crunch as carriers take time off.
The question is whether recent rate increases indicate a lasting shift or a temporary “sugar rush” caused by weather and the calendar. For now, the signs point to the latter. Carrier exits, bankruptcies, and stricter roadside enforcement are shrinking capacity at the edges, but not enough yet to create sustained, demand-driven pricing power for carriers.
About DAT Freight & Analytics
DAT Freight & Analytics operates DAT One, North America’s largest truckload freight marketplace; DAT iQ, the industry’s leading freight data analytics service; the Convoy Platform automated freight-matching service; Trucker Tools, the leader in load visibility; and Outgo, the financial services platform for truckers. Check out the latest DAT iQ Market Update every Tuesday or on demand: https://www.youtube.com/DATLoadBoards. dat.com
Load and truck posts refer to the number of posts on the DAT One marketplace during Week 50 (Dec. 7-13). Load volume refers to the number of loads moved. Rates are aggregated from invoice data submitted to DAT iQ. Linehaul rates subtract an amount equal to an average fuel surcharge.
Media contact for an interview or additional data:
Stephen Petit
SiefkesPetit Communications
425-443-8976

News you need.
Join Blue Book today!
Get access to all the news and analysis you need to make the right decision --- delivered to your inbox.


Subscribe to our newsletter
© 2026 Blue Book Services. All Rights Reserved

