DAT: Spot truckload rates continued to strengthen
National average spot rates rose across all three equipment types last week as winter weather continued to ripple through freight networks.

BCFC/Shutterstock
National average spot rates rose across all three equipment types last week as winter weather continued to ripple through freight networks, tightening available truckload capacity.
Freight trends from DAT One and DAT iQ
Spot market data for Feb. 1-7, 2026 (Week 6)
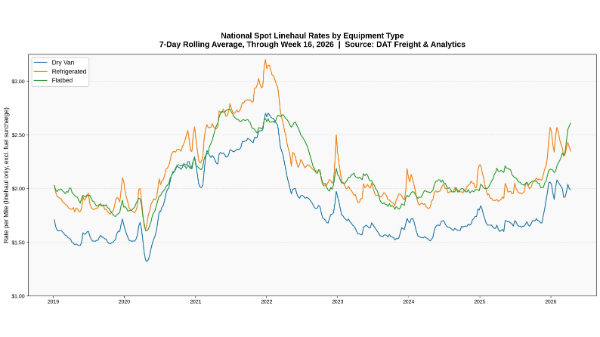
Broker-to-carrier 7-day average spot rates:
▲ Dry van: $2.45 per mile, up 7 cents week over week
▲ Refrigerated: $2.94 per mile, up 9 cents
▲ Flatbed: $2.58 per mile, up 5 cents
The total number of loads posted to the DAT One load board decreased 1% to 3.7 million but was nearly double the same week in both 2024 and 2025. The modest overall weekly decline in load posts masks demand for different equipment types, with van load posts down 3% while flatbed load posts surged 10%. Truck posts increased 2% to 217,734, down 14% year over year.
Dry van
▼ Van loads: 1.65 million, down 3% week over week
▲ Van equipment: 154,611, up 2% week over week
▲ Linehaul rate: $2.08 per mile, up 7 cents week over week
Reefer
▼ Reefer loads: 942,472, down 10% week over week
▲ Reefer equipment: 36,670, up 3% week over week
▲ Linehaul rate: $2.57 per mile, up 8 cents week over week and 59 cents higher than the same period last year
Flatbed
▲ Flatbed loads: 1.1 million, up 10% week over week
▲ Flatbed equipment: 22,434, up 2% week over week
▲ Linehaul rate: $2.21 per mile, up 5 cents week over week
Market analysis from Dean Croke, Industry Analyst, DAT Freight & Analytics
The average spot van rate for DAT’s top 50 lanes by load volume was $2.32 per mile last week, 25 cents higher than the national average spot rate. In the 13 Midwest states, which represent around 45% of national load volume and often signal future national trends, the average spot van rate increased by 19 cents to $2.58 per mile. That’s 50 cents above the national average. Winter weather disruptions across the eastern half of the country, combined with typical February restocking activity, are tightening capacity and pushing rates higher in key freight corridors. The Midwest premium suggests this trend may spread nationally in the coming weeks.
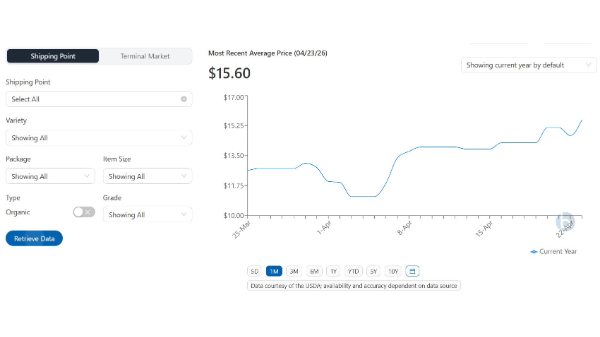
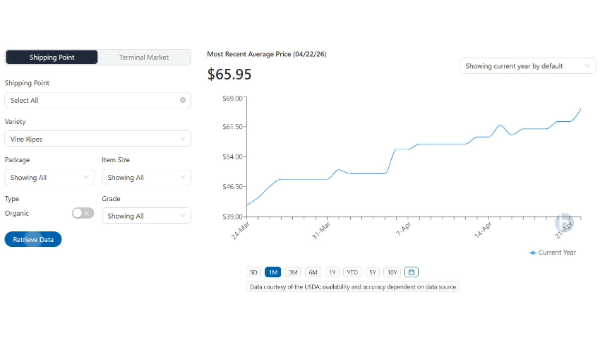
California’s produce regions continue to face reefer capacity shortages for moving leafy greens, vegetables, and specialty items. Spot rates to East Coast markets averaged in the $8,300-9,000 range (approximately $2.65-2.88 per mile for 3,100-mile hauls from the Coachella and Imperial Valley regions). The Kern District, Oxnard, and Santa Maria area are similarly constrained, particularly for reefer to haul specialty items like strawberries, celery, and grapes. These shortages reflect the agricultural sector’s peak shipping season, coinciding with reduced truck availability across the West.
Flatbed load posts are running 60% higher than last year and 35% above the long-term average. At $2.21 per mile, the national average spot flatbed rate is 25 cents higher than last year and 28 cents above the same week in 2018.
The flatbed demand story gained support from ISM’s Manufacturing PMI, which rose to 52.6 in January, returning to expansion territory after months of contraction. However, this is not a “flip the switch” moment for flatbed carriers. Factory employment remains cautious, suggesting manufacturers are leaning on existing capacity rather than ramping up production significantly. For trucking, that typically means uneven freight: bursts of activity tied to restocking and backlog clearance rather than sustained, broad-based growth.
Carriers should view the 52.6 PMI reading as an encouraging early signal, not confirmation of a full recovery. If February and March data show orders and production continuing to firm, capacity discipline could finally start to matter again. For now, the flatbed market suggests the floor is forming under industrial freight, even if meaningful rate improvement remains distant.
About DAT Freight & Analytics
DAT Freight & Analytics operates DAT One, North America’s largest truckload freight marketplace; DAT iQ, the industry’s leading freight data analytics service; the Convoy Platform automated freight-matching service; Trucker Tools, the leader in load visibility; and Outgo, the financial services platform for truckers. Check out the latest DAT iQ Market Update every Tuesday or on demand: https://www.youtube.com/DATLoadBoards.
Load and truck posts refer to the number of posts on the DAT One marketplace during Week 6 (Feb. 1-7). Load volume refers to the number of loads moved. Rates are aggregated from invoice data submitted to DAT iQ. dat.com

News you need.
Join Blue Book today!
Get access to all the news and analysis you need to make the right decision --- delivered to your inbox.


Subscribe to our newsletter
© 2026 Blue Book Services. All Rights Reserved

