ProduceIQ: Tracking U.S.-Iran truce and oil price relief
As the 2026 FIFA World Cup kicks off across North America, global markets are watching another high-stakes contest unfold.

Images courtesy ProduceIQ
As the 2026 FIFA World Cup kicks off across North America, global markets are watching another high-stakes contest unfold.
News that the United States and Iran have agreed to a peace deal, with a formal signing expected June 19, has oil traders cheering what could be a major breakthrough for global shipping and energy markets.
The Strait of Hormuz is expected to reopen imminently if the agreement holds. Oil prices are already reacting to the news, but buyers may want to wait for the final whistle before celebrating.
If finalized, lower fuel costs could eventually ease pressure on transportation, packaging and production expenses across the produce supply chain. In the meantime, produce buyers remain focused on a market that is delivering plenty of drama of its own.
ProduceIQ Index: $1.21/pound, up +10.7 percent over prior week
Week #24, ending June 12th
Blue Book has teamed with ProduceIQ BB #:368175 to bring the ProduceIQ Index to its readers. The index provides a produce industry price benchmark using 40 top commodities to provide data for decision making.
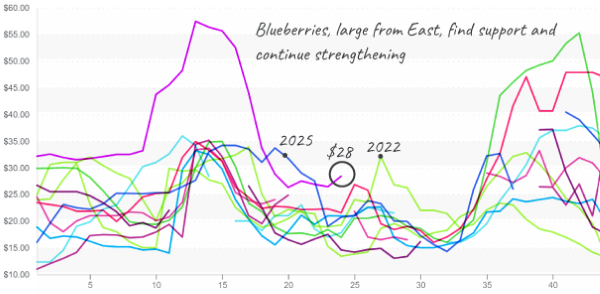
Blueberry prices have climbed to a ten-year high. Average prices are up +15 percent from the previous week due to a widening supply gap. In the East, production in Georgia and Florida has finished, while Michigan and New Jersey are not yet in full swing, leaving buyers caught between seasons. The result is a short supply window that has pushed prices sharply higher.
Blueberry supplies remain under pressure as declining production in Mexico strains California growers, who are also struggling to maintain yields. California production may shut down earlier than usual, widening the transition gap before growers in the Pacific Northwest hit their stride.
Prices may rise further over the next two weeks until growers in the East and West can share the fruits of peak summer production.
Blueberries tick upwards from already high levels for this time of year
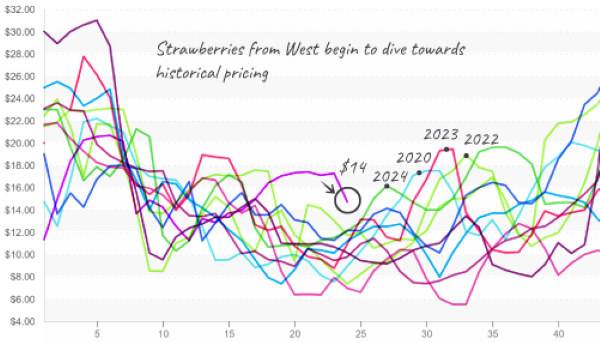
While blueberry prices are still resisting summer’s pull, strawberry markets are finally hearing the call. Average prices are down -22 percent from the previous week and will likely fall further towards historical norms as favorable weather boosts yields and improves availability. Barring weather disruptions, strawberries appear poised, once again, to be one of summer’s best values.
Strawberry prices poised to return to historical pricing patterns soon
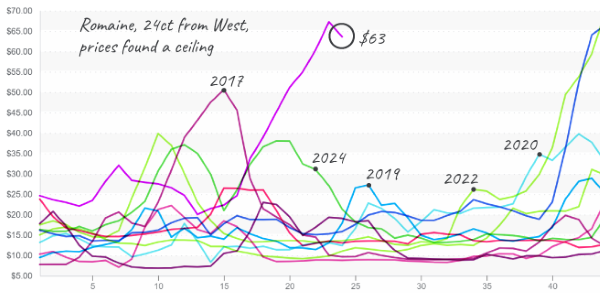
Historic romaine prices may have finally found their ceiling. For the first time in nine weeks, the average price declined, slipping -5 percent from the previous week.
Unfortunately for buyers, improving yields are not responsible for the minor retreat. Weakening end-of-school-year demand and buyers with price fatigue are doing more to cool the market than improving production. Volume out of the Salinas-Watsonville region is down week-over-week, and overall supply is not expected to improve until July.
Romaine retreats after testing the resolve of buyers
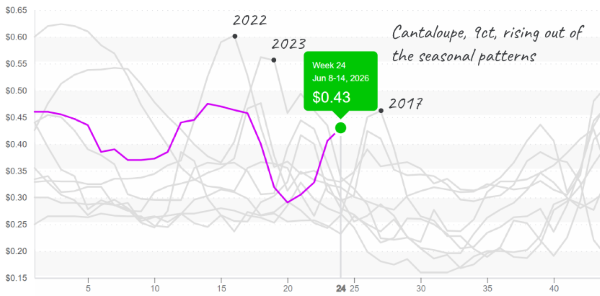
Cantaloupe markets remain in full-blown demand-exceeds-supply mode. Severe insect and disease pressure, combined with an early end to Arizona’s season, has left supplies well below normal for Week #24.
Average prices continue to climb as buyers compete for limited volume from Arizona and California. Relief is unlikely until San Joaquin Valley production gains momentum, leaving buyers with at least a few more weeks of elevated prices.
Cantaloupe prices rebound during the last few weeks of their volatile season
ProduceIQ saves you time and provides valuable information to increase your profits.
The ProduceIQ Index is the fresh produce industry’s only shipping point price index. It represents the industry-wide price per pound at the location of packing for domestic produce and at the port of U.S. entry for imported produce.
ProduceIQ uses 40 top commodities to represent the industry. The Index weights each commodity dynamically, by season, as a function of the weekly 5-year rolling average Sales. Sales are calculated using USDA Agricultural Marketing Service data on movement and prices. The Index serves as a fair benchmark for industry price performance.
News you need.
Join Blue Book today!
Get access to all the news and analysis you need to make the right decision --- delivered to your inbox.


Subscribe to our newsletter
© 2026 Blue Book Services. All Rights Reserved

